Collection Alpha R
Drone
The drone dataset comprises information from 152 flights conducted in the two key regions of the HARMONIZE Project in Brazil: Lower Tocantins (PA) and Semiarid (PB) regions. The flights were carried out during HARMONIZE field campaigns in 2022, 2023 and 2024. The collection includes all images, mosaics, and NDVI products generated from MAVIC 3M and Phantom flights. Figure below illustrates the spatial distribuition and details of these flights recorded throughout the field campaigns.
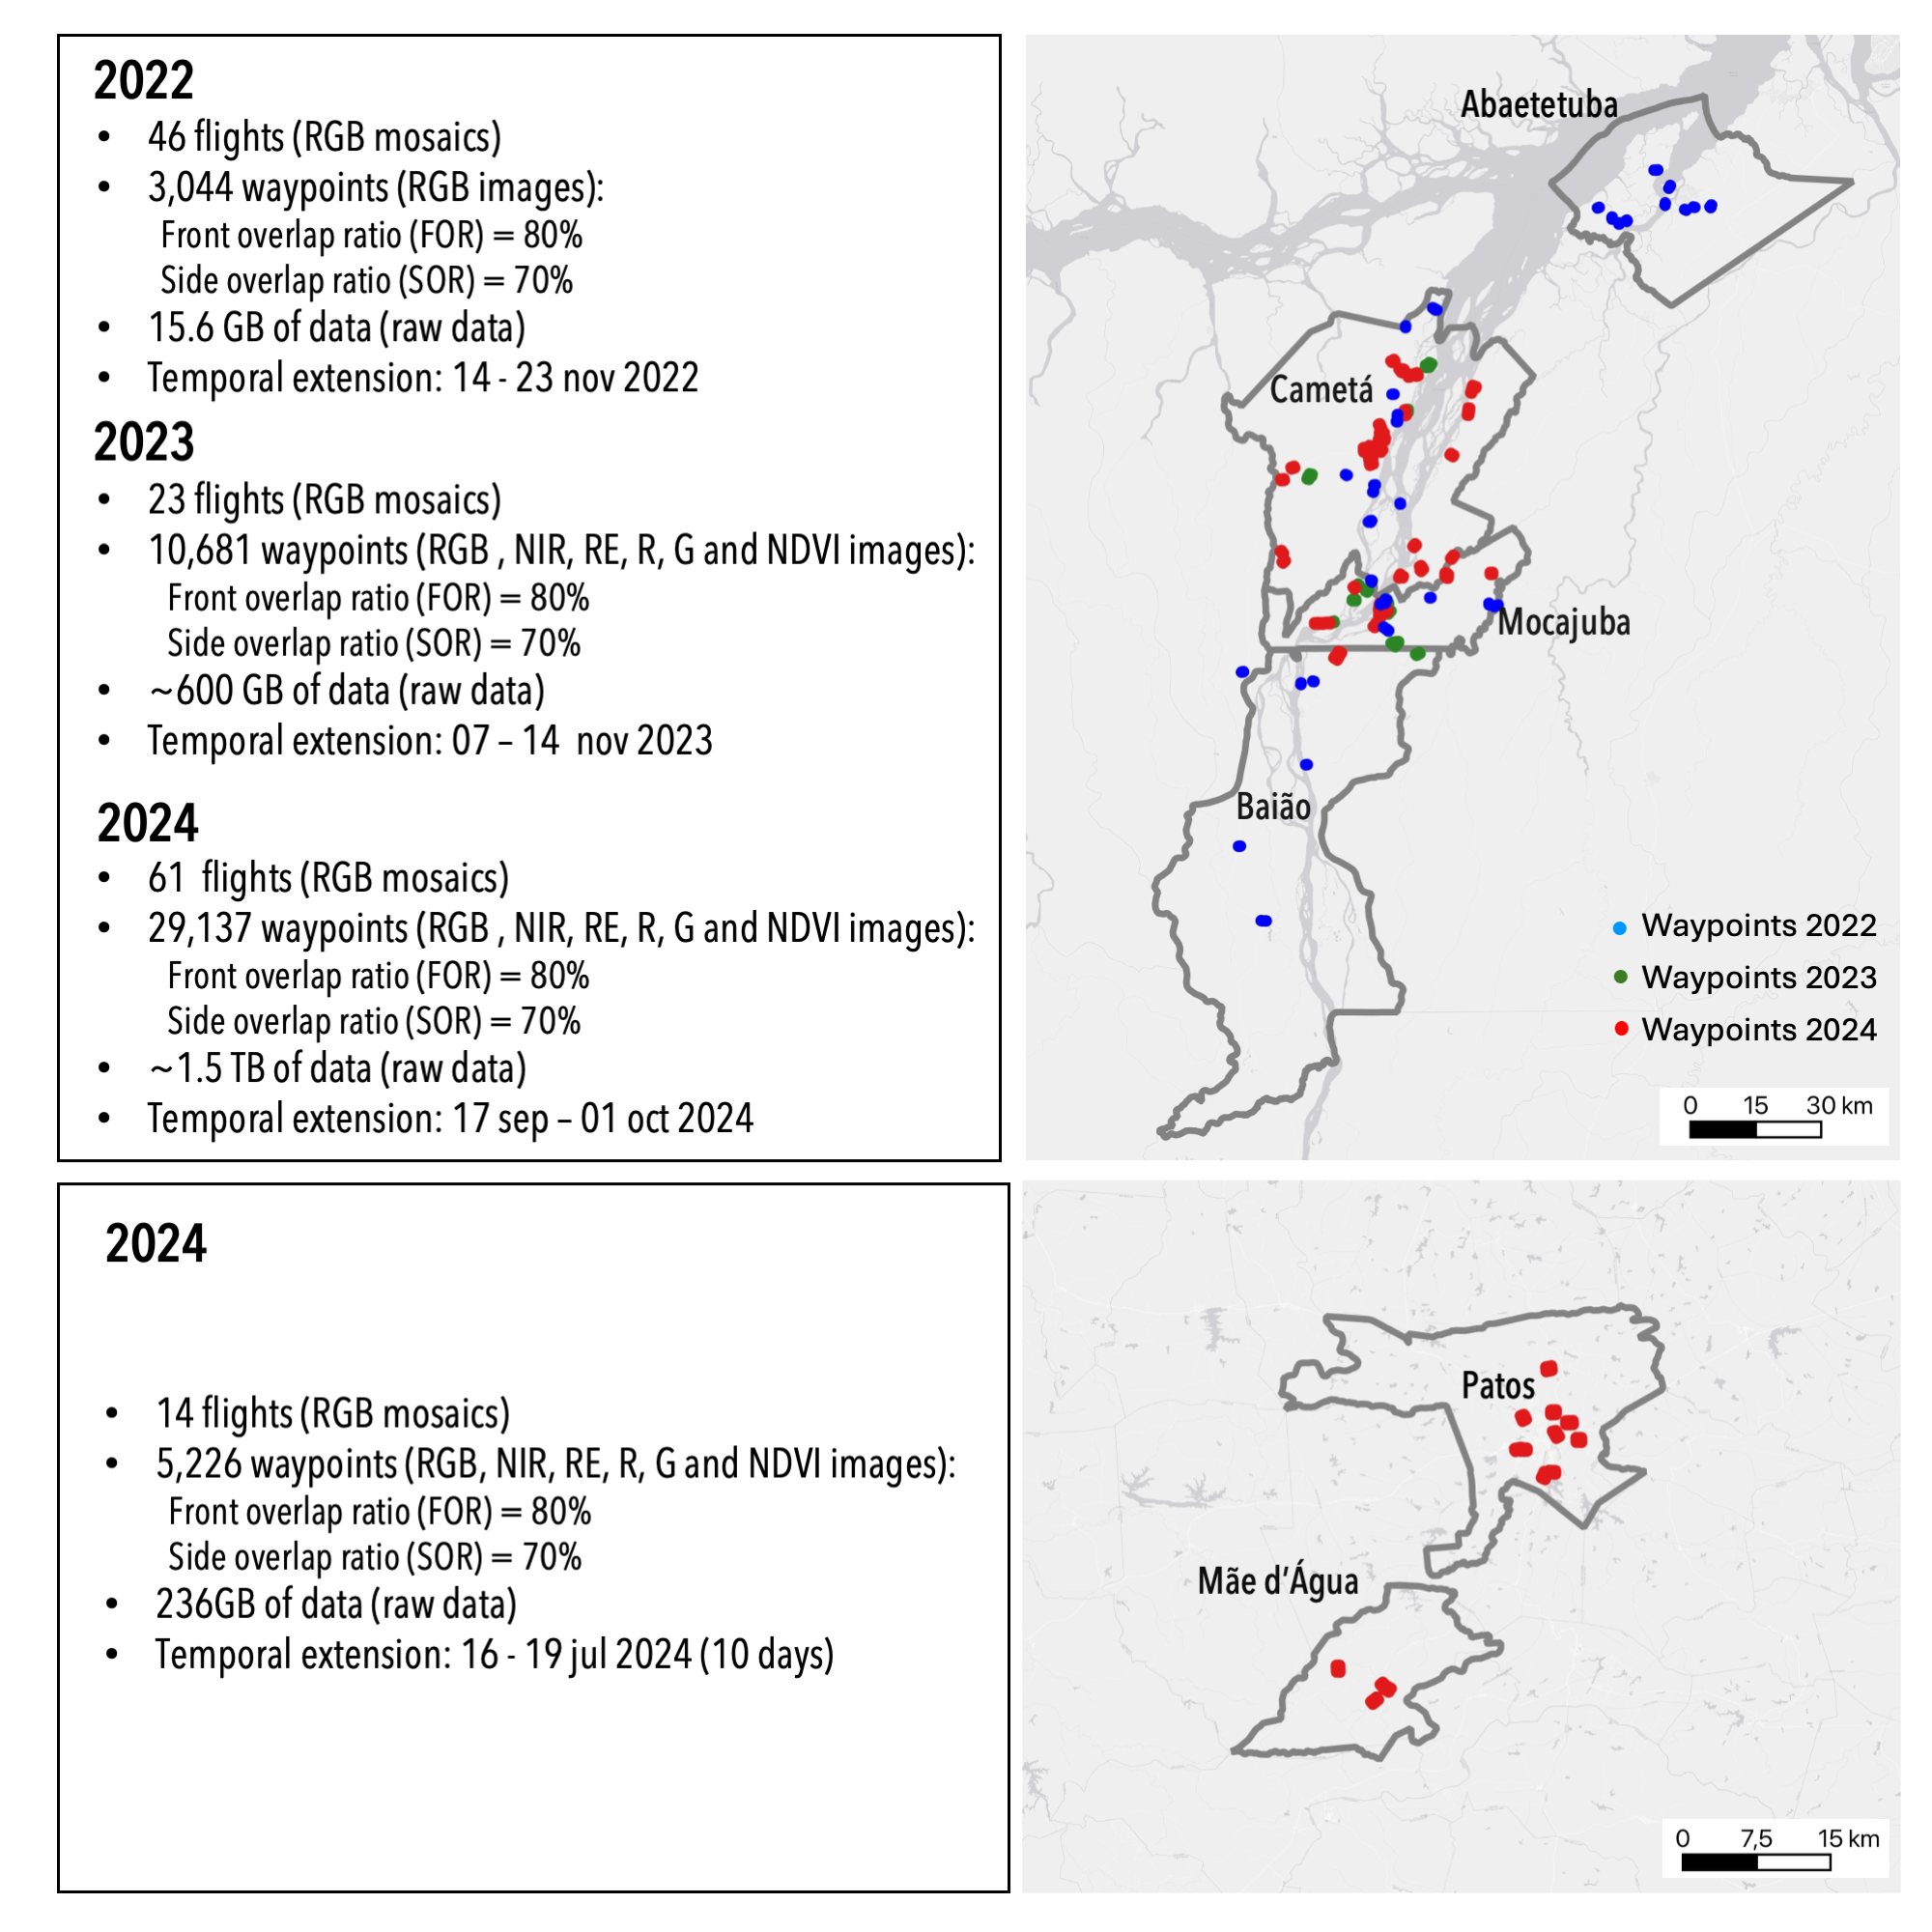
Figure 6 - HARMONIZE Project hotspots.
Health data
The health dataset focuses on municipalities in the same two regions. It is derived from Fiocruz’s Health Information Laboratory (LIS), at ICICT/Fiocruz, and the InfoDengue initiative, both of which produce health indicators addressing the impacts of environmental and climate change on the Brazilian population. The indicators selected for this collection (see table below) emphasize vector-borne diseases relevant to the HARMONIZE Project and encompass data from the past 15 years. In this collection, attribute names for climate and health data (Shapefile and GeoJSON) were standardized to enhance interoperability across systems.
| Indicator | Spatial aggregation | Temporal aggregation | Period | Data source |
|---|---|---|---|---|
| Dengue mortality rate per 100.000 inhabitants | Municipality | By month | Jan 2000 - Dec 2010 | Health Information Laboratory (LIS) ICICT/Fiocruz |
| Dengue confirmed cases | Municipality | By month | Jan 2000 - Dec 2010 | Health Information Laboratory (LIS) ICICT/Fiocruz |
| Chikungunya confirmed cases | ||||
| Zika confirmed cases | ||||
| Chagas disease cases | ||||
| Number of Dengue cases reported | Municipality | By epidemiological week | Jan 2010 - Dec 2025 | Mosqlimate - InfoDengue |
| Number of Chikungunya cases reported | ||||
| Number of Zika cases reported | ||||
| Estimated Dengue incidence rate (cases per population x 100.00) | ||||
| Estimated Chikungunya incidence rate (cases per population x 100.00) | ||||
| Estimated Zika incidence rate (cases per population x 100.00) | ||||
| Dengue alert level | ||||
| Chikungunya alert level | ||||
| Zika alert level |
Climate data
The climate data also cover the Lower Tocantins and Semiarid regions. The collection was produced using datasets generated by Raphael Saldanha (doi:10.1017/eds.2024.3), by the Fiocruz team, who produced daily aggregates of selected ERA5-Land indicators for the Latin America region (’https://rfsaldanha.github.io/data-projects/era5land-daily-latin-america.html’), stored in NetCDF format. In addition to these datasets, the collection integrates climate datasets from the Center for Weather Forecast and Climate Studies (CPTEC/INPE), such as precipitation from the MERGE product (’http://ftp.cptec.inpe.br/modelos/tempo/MERGE’) and temperature from the SAMeT product (’http://ftp.cptec.inpe.br/modelos/tempo/SAMeT’), expanding the diversity of variables and ensuring a comprehensive climate characterization for the regions of interest. The Collection Alpha R spans January 2010 to October 2025, and table below lists the included climate indicators.
| Indicator | Spatial aggregation | Temporal aggregation | Period | Data source |
|---|---|---|---|---|
| Maximum, mean and minimum temperature (°C) | Municipality | Epidemiological week and month | Jan 2010 - Dec 2025 | ERA5-Land (Saldanha - indicator 2m temperature) |
| Maximum, mean and minimum precipitation (mm) | Municipality | Epidemiological week and month | Jan 2010 - Dec 2025 | ERA5-Land (Saldanha - indicator 2m temperature) |
| Relative humidity (%) | Municipality | Epidemiological week and month | Jan 2010 - Dec 2025 | ERA5-Land (Saldanha - indicator 2m temperature and 2m dewpoint temperature) |
| Maximum temperature anomaly (in number of consecutive days) |
Municipality | Epidemiological week and month | Jan 2010 - Dec 2025 | Maximum Temperature of the Climatological Normal (INMET) and ERA5-Land (Raphael Saldanha - indicator 2m temperature) |
| Maximum, mean and minimum temperature (°C) | Municipality | Epidemiological week and month | Oct 2010 - Oct 2025 | SAMeT - CPTEC/INPE |
| Maximum, mean and minimum precipitation (mm) | Municipality | Epidemiological week and month | Oct 2010 - Oct 2025 | MERGE - CPTEC/INPE |